
Fall 2026: Buyers Are Taking Their Time
Golden Town & Golden Rural · January–September 2026 vs. the same period in 2025 · Kicking Horse Mountain Resort excluded
If I had to describe the Golden real estate market heading into fall, I wouldn’t call it a buyer’s market or a seller’s market.
I’d call it a selective market.
Buyers are still out there, properties are still selling, and in some parts of our market there isn’t a lot to choose from. But buyers are taking their time, focusing on value, and waiting for the right property.
As always in Golden, the numbers need some context. Golden Town and Golden Rural are two very different markets, so I’ve looked at them separately rather than combining everything into one set of statistics.
I’m also leaving Kicking Horse Mountain Resort out of this update entirely. The resort market behaves very differently from both Town and Rural Golden, and I’ll take a separate look at KHMR as we head into the winter ski season.
Golden Town: Less Inventory, Longer Selling Times
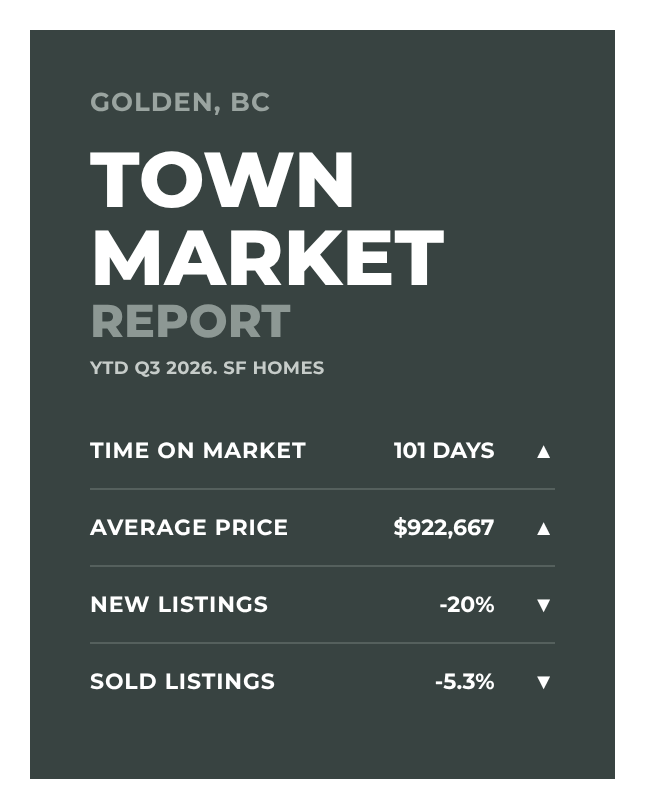
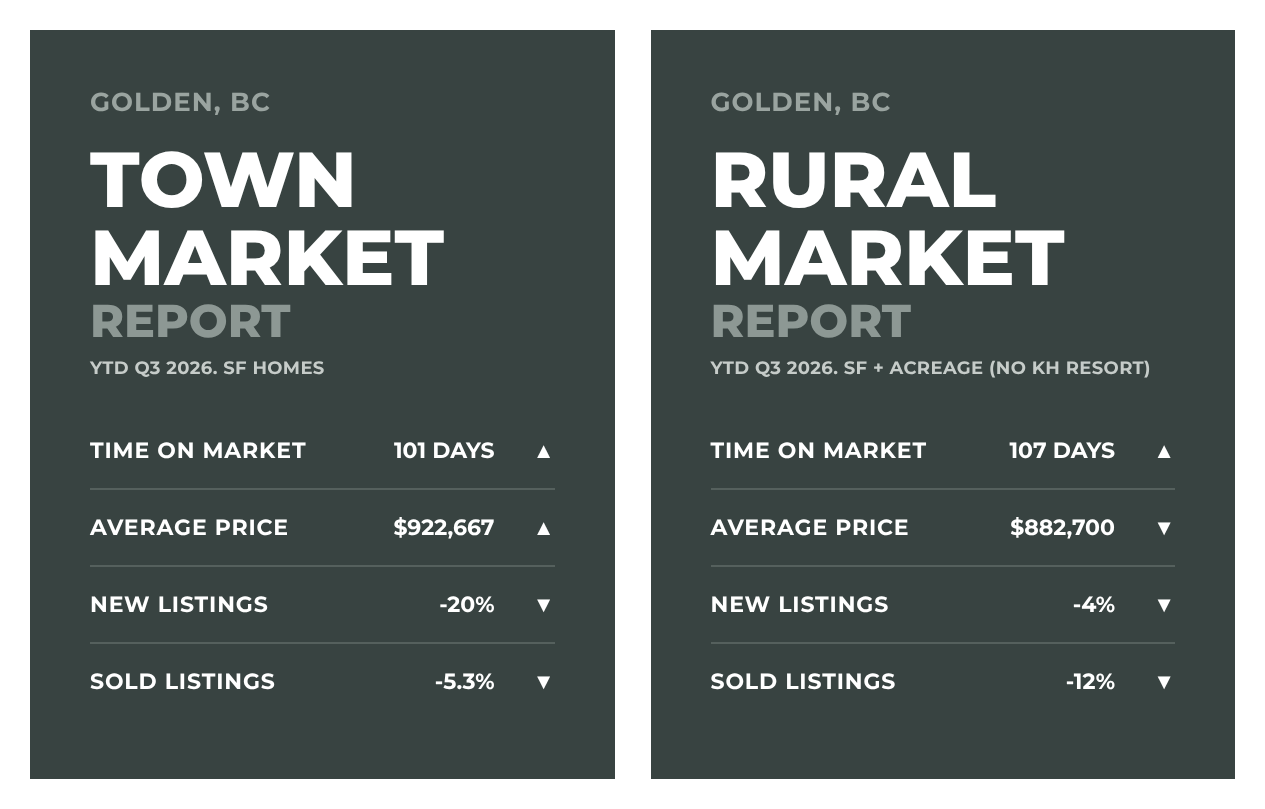
Through the end of September, 18 single-family detached homes have sold in Golden Town, compared with 19 during the same period last year. Sales activity is essentially holding steady year over year.
What’s changed is the amount of new inventory coming onto the market.
There have been 37 new listings so far this year compared with 46 at this point in 2025 — a decrease of almost 20%. At the end of September, there were 15 active listings, down from 19 last year.
You might expect fewer homes for sale to mean properties are selling faster.
We’re actually seeing the opposite.
Average days on market for the homes that have sold have increased from approximately 76 days last year to 101 days this year. Sellers have received an average of 94.85% of their asking price.
To me, that’s one of the more important stories in our market right now.
Less inventory doesn’t automatically mean buyers will pay any price.
Buyers have fewer choices, but they’re still comparing properties carefully and waiting when the price, condition or property itself doesn’t feel right. For sellers, pricing appropriately from the beginning continues to matter.
Golden Town at a glance
Year to date, January–September · Single family detached
| Year to date (Jan–Sept) | 2025 | 2026 | Change |
|---|---|---|---|
| Homes sold | 19 | 18 | −1 sale |
| New listings | 46 | 37 | −20% |
| Average sale price | $798,874 | $922,667 | +15.5%* |
| Sale price as % of list price | 95.4% | 94.9% | steady |
| Average days on market | 76 | 101 | +25 days |
| Homes for sale (Sept 30) | 19 | 15 | −21% |
| Months of supply | 11.4 | 6.0 | −47% |
*With 18 sales, a few higher-priced homes can move the average a long way. The Kootenay benchmark comparison below gives a steadier read on value.
Golden Rural: A Different Market, But a Similar Trend
Rural Golden tells a somewhat different story.
A quick note about the numbers: for Golden Rural, I’ve included properties classified in MLS® as both Single Family – Detached and Single Family – Detached with Acreage. Rural properties aren’t always entered under the same subtype by listing agents, so including both gives us a better picture of rural residential activity than looking at either classification alone.
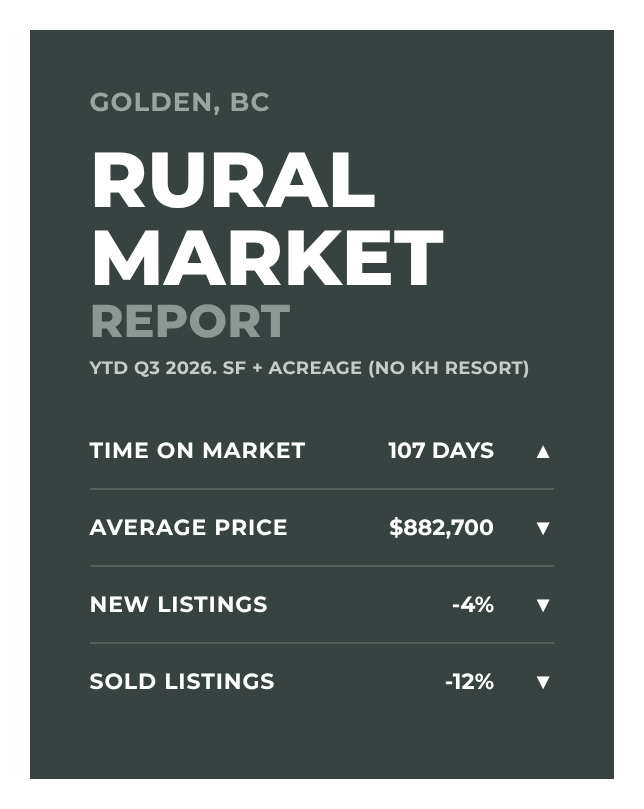
Through September, 15 rural properties have sold this year compared with 17 last year, a decrease of about 12%. New listings are almost unchanged, with 45 this year compared with 47 in 2025.
And unlike Town, rural inventory hasn’t really tightened. There were 30 active rural listings at the end of September — exactly the same as last year.
But there is one notable similarity between Town and Rural: properties are taking longer to sell.
Average days on market in Golden Rural has increased from approximately 75 days last year to 107 days this year.
The average rural sale price is also down approximately 6.5% year to date, from about $944,000 to $883,000.
But I always put a big asterisk beside average prices in our rural market.
Golden Rural isn’t one type of property.
A small acreage close to town, a larger property farther out, an older home requiring work, and a newer home on several acres can all land in the same dataset. A handful of higher- or lower-priced sales can move the average considerably.
That’s why I look at rural price averages as one piece of the picture rather than treating them as a measure of what every rural property has gained or lost in value.
Golden Rural at a glance
Year to date, January–September · SF detached + SF with acreage
| Year to date (Jan–Sept) | 2025 | 2026 | Change |
|---|---|---|---|
| Homes sold | 17 | 15 | −2 sales |
| New listings | 47 | 45 | −4% |
| Average sale price | $943,735 | $882,700 | −6.5% |
| Sale price as % of list price | 93.6% | 93.2% | steady |
| Average days on market | 75 | 107 | +32 days |
| Homes for sale (Sept 30) | 30 | 30 | unchanged |
| Months of supply | 18.0 | 16.4 | −9% |
How Does Golden Compare With the Rest of the Kootenays?
This is where the fall numbers get particularly interesting.
Across the broader Kootenay region, September residential sales were up 9.1% compared with September 2025. Active listings were up just 1.6%, while new listings were down 4.1%.
For single-family homes specifically, Kootenay sales in September increased 15% year over year, while the average time to sell fell 9% to 75 days. That’s a noticeable contrast to Golden, where days on market have increased in both Town and Rural.
Before comparing prices between communities, there is an important distinction.
The regional Association statistics use a benchmark price, not an average sale price. A benchmark estimates the value of a typical home in a particular market. That’s different from the average sale prices I’ve referenced above for Golden, which are calculated from the properties that actually sold and can move considerably when there are only a small number of sales.
With that distinction in mind, Golden’s single-family benchmark sits above Cranbrook and Kimberley, relatively close to Rossland, below Nelson and Invermere, and well below Fernie.
Kootenay benchmark prices
Single family · September 2026 vs September 2025
| Community | Benchmark Sept 2026 | Change from Sept 2025 |
|---|---|---|
| Fernie | $1,057,200 | +4.7% |
| Golden Rural** | $873,400 | +1.5% |
| Invermere Rural | $836,800 | +5.4% |
| Invermere | $824,600 | +6.2% |
| Nelson | $783,700 | +4.5% |
| Rossland | $712,300 | +8.4% |
| Golden | $692,000 | +1.9% |
| Cranbrook | $580,600 | +3.3% |
| Kimberley | $540,300 | +5.6% |
| Kootenay region overall | $638,300 | +5.0% |
**Benchmark prices exclude lakefront and acreage homes, so “Golden Rural” here is a narrower group than the rural numbers above.
What stands out more to me is how little Golden has moved. Our typical home is up 1.9% from last September, and Golden Rural is up 1.5%. Across the Kootenays, the benchmark is up 5%. Of the 22 communities with a reported change, both Golden markets are among the five slowest.
It also puts our Town average in perspective. The typical Golden home isn’t worth 15% more than it was last year — a few higher-priced sales pulled that average up.
It’s useful regional context, but it doesn’t mean those communities — or individual properties within them — are directly comparable.
The Bigger BC Picture
Golden isn’t operating in isolation either.
BCREA has described the provincial market as experiencing a “slow but steady sales recovery.” In August, BC residential sales were still down 4.7% from the previous year and remained 25.4% below the ten-year average for August.
The Kootenay has held up relatively well within that broader environment. Through August, Kootenay unit sales were down 6.2% year to date, while average price was up 3.1%. Across BC, unit sales were down 5.5%, and average price was down 1%.
Source: BCREA, August 2026 statistics release
So, What Does This Mean Heading Into Fall?
I think this is where the numbers become more useful than simply asking whether prices are “up” or “down.”
Golden Town has fewer homes coming onto the market and less inventory than it did last year, yet properties are taking longer to sell.
Golden Rural has roughly the same amount of inventory as last year and slightly fewer sales, and properties are also taking longer to sell.
In both markets, buyers appear willing to wait for the right property and the right value.
For sellers, that means simply being on the market when inventory is limited isn’t enough. Pricing and positioning matter. Buyers are paying attention, and an overpriced property can still sit even when there isn’t much competition.
For buyers, longer days on market don’t necessarily mean there’s suddenly an abundance of choice or that every seller is highly negotiable. Some segments of Golden remain quite limited, and the right property can still attract attention when it comes along.
That’s why I don’t think the Golden market this fall fits neatly into a buyer’s-market or seller’s-market box.
It’s not a frantic market. It’s not an inactive market. It’s a selective one.
And in a small market like Golden — where relatively few sales can dramatically change an average or percentage — understanding what’s happening with the specific type of property you’re buying or selling matters far more than any single headline number.
Wondering what these numbers mean for your own place?
Or for a move you’re weighing? Let me know — happy to walk through it with you.
You can see the full report and more information here:
Golden Town Report
Golden Rural Report
AMBER
Amber Granter PREC · 236-304-4955 · amber@mountaintownliving.ca
Market data compiled from the Association of Interior REALTORS® (RE STATS Inc.) and the British Columbia Real Estate Association (BCREA). Golden statistics are year-to-date through September 30, 2026. Golden Town statistics are based on Single Family – Detached properties. Golden Rural statistics include Single Family – Detached and Single Family – Detached with Acreage classifications to better capture rural residential activity. Kootenay community benchmark prices: Association of Interior REALTORS® September 2026 Kootenay Region release (single family, excluding lakefront and acreage). Provincial and Kootenay board figures: BCREA August 2026 statistics release. Kicking Horse Mountain Resort is excluded from this update and will be covered separately. Information is deemed reliable but not guaranteed and does not reflect all market activity.